2026-03-06
I’ve spent the last ten years building, breaking, and rebuilding revenue systems across more than thirty companies. And the thing I keep running into, the pattern that won’t stop repeating itself, is this: it’s not one sales funnel. It’s funnels all the way down.

There’s an old philosophical story, usually attributed to Bertrand Russell. A scientist finishes a lecture on how the earth orbits the sun. An elderly woman approaches him afterward and says: “That’s all very nice, young man, but the earth actually rests on the back of a giant turtle.”
The scientist smiles. “And what does the turtle stand on?”
“Another turtle,” she says.
“And that turtle?”
She waves him off. “You’re very clever, young man. But it’s turtles all the way down.”

The joke lands because it’s absurd. But it also lands because it points at something real: a system where every explanation requires another beneath it. No foundation. No bottom layer. The structure is recursive.
I’ve spent the last ten years building, breaking, and rebuilding revenue systems across more than thirty companies. And the thing I keep running into, the pattern that won’t stop repeating itself, is this: it’s not one sales funnel. It’s funnels all the way down.
Once you see it, you can’t unsee it. And once you can’t unsee it, the way you operate changes.

The teams that perform at the highest level aren’t smarter about tactics. They have better observability. They’re seeing at a finer grain. And that higher resolution generates better questions, which generates better interventions, which generates compounding results.

Everyone knows the basic sales funnel. Awareness, interest, consideration, intent, purchase. If you’ve spent any time in marketing or sales, some version of this lives in a dashboard you look at regularly. It’s common language. It’s useful shorthand.
It’s also incomplete. And the incompleteness isn’t a minor oversight. It’s the thing that keeps most revenue teams stuck.
The classic sales funnel treats each stage as a single step. “Meeting Booked” is a stage. “Discovery Call” is a stage. “Proposal Sent” is a stage. But each of these stages, when you actually look at what happens inside them, is its own funnel with its own entry points, its own conversion dynamics, its own places where people fall out.
Take “Meeting Booked.” It sounds like a binary: the meeting is booked, or it isn’t. But across our client base, only about 70% of booked meetings actually happen. That means 30% of people who signal intent, who took the time to pick a time slot, who are theoretically ready to have a conversation, never show up.
It has its own shape, its own behaviors, its own levers. And if you’re not seeing it as a funnel, if it’s just an invisible gap between “booked” and “held,” you’re leaving real revenue on the table.
Here’s what happens when you start to see it: if I know that 72 out of the last 100 booked meetings actually happened, I know exactly what to do with the 28 that didn’t. I can look at their lead scores. I can look at what source they came from. I can build a rebook sequence that’s relentless. Call them, text them, email them. Automate as much of it as makes sense, and make the rest a human priority. If I can get 50% of those 28 back into a meeting, I’ve just changed the math on my entire pipeline without generating a single new lead.
This is what I mean by recursive. Every exit from one funnel is an entrance to another. Rebook sequences, nurture tracks, revival campaigns, long-term cultivation. The system doesn’t have a bottom. It loops back on itself. And the teams that understand this, the ones that build intentionally at every level, are the ones that compound small gains into something transformative.

The insight about recursive funnels is interesting, but it’s not the point by itself. The point is what it implies about how you operate.
Most RevOps teams obsess over the macro funnel. They stare at the big conversion rate, the one number that’s supposed to tell them whether things are working. And when that number doesn’t move, they try bigger interventions: new messaging, new tools, new hires, new strategy. They’re trying to move the whole system at once because that’s the only level at which they can see it.
It’s in the micro-funnels running on autopilot inside each stage, or (more commonly) the micro-funnels that should exist but don’t.
There’s a way to think about this that’s helped me frame it for our clients: RevOps maturity isn’t a function of your tools or your tactics. It’s a function of the resolution at which you can observe your system.
Think about it like resolution in any complex system. At low resolution, everything looks like one big funnel with one conversion rate. At higher resolution, you start to see the nested funnels inside each stage. Higher still, and you see the geometry of each funnel: not just how many people get through, but the shape of how they move. And at the highest resolution, you can see the exit points, categorize them, and determine which states are within your control and which ones aren’t.
They have better observability. They’re seeing at a finer grain. And that higher resolution generates better questions, which generates better interventions, which generates compounding results.
It starts with perception. With awareness. With training yourself to look at what’s actually there instead of what you expect to see. The creative work isn’t just in the solutions you design. It’s in learning to see the problems that were invisible before.
We describe funnels with one number: conversion rate. But conversion rate is a single dimension. It tells you how many people got through, which is useful, but it tells you nothing about how they moved, where they stalled, where they fell out, or what the state of that funnel actually looks like at any given point.
Funnels have geometric properties. And those properties dictate what kind of architecture you need to build around them.

Width is the ratio between entry breadth and exit selectivity. A funnel that’s very wide at the top and very narrow at the bottom has high qualification intensity. That might be by design (you’re running broad awareness campaigns and filtering aggressively), or it might be by dysfunction (you haven’t figured out your ICP and you’re wasting volume on the wrong people). Width tells you whether the problem is at the top, the bottom, or both. The question isn’t just “is our top wide enough?” It’s “is our bottom the right width for our business model?”
Length is time to traverse. Some funnels are naturally long. Complex B2B sales, high-consideration purchases, enterprise contracts with multiple stakeholders. Some are naturally short. Transactional, low-friction, one-call-close. Length isn’t inherently good or bad, but mismatched expectations about it create real problems.
I see this constantly. A team with a naturally long sales cycle tries to compress it because they’re under quarterly pressure, and the compression breaks the trust-building that the cycle naturally creates. Or the reverse: a team over-engineers a process around what should be a fast, simple transaction, adding friction that slows down something that wants to move quickly.
If you have a one-call-close motion with a low win rate, you might find that adding a step (splitting the discovery from the proposal, for instance) actually increases throughput because it gives the prospect more time and more touchpoints to build confidence. You’ve lengthened the funnel but widened the bottom. That’s a trade most teams wouldn’t think to make because they’re measuring length as a cost rather than a design choice.
Slope is the shape of the narrowing. A funnel that goes 1,000 to 800 to 600 to 400 is geometrically different from one that goes 1,000 to 950 to 900 to 200. Same starting point. Same ending point. Radically different stories.
The gradual funnel is filtering steadily at each stage. The cliff funnel is holding almost everyone until a single point where it drops off a ledge. And that cliff is screaming for attention. Something is broken at that stage, or that’s where real qualification happens and everything upstream was too loose.
I had a client recently where the overall conversion rate looked fine. But when we mapped the slope, we found a cliff between “proposal sent” and “proposal reviewed.” Proposals were going out, and then… nothing. The deals weren’t dying. They were entering a stalled state. When we dug in, the problem was mechanistic: the team was sending proposals via email (“Hey, let me know what you think”) and then waiting. No live review. No scheduled follow-up call. No mechanism to create momentum at the exact point where momentum matters most.
Porosity is where leads exit through the walls of the funnel before reaching the bottom. This is the “leaky bucket” concept, but more nuanced.

A prospect who doesn’t have budget right now isn’t dead. They’re a candidate for a nurture sequence that keeps them warm until budget cycles change. A contact who was interested but whose champion left the company isn’t a loss. They’re a candidate for reconnection when the new person is in place.
The distinction that matters is between leaks and valves. Leaks are unintentional exits. Nobody planned for them, nobody’s managing them, and the people who fall out disappear from the system entirely. Valves are intentional offramps: designed exits that route people into secondary funnels where they can be recaptured, recycled, or cultivated.
Mature RevOps converts leaks to valves. When someone falls out of a funnel, you should know where they went, why they left, and what funnel catches them next. The question isn’t just “where are we losing people?” It’s “where are they going, and is that by design?”
The geometry framework is useful in the abstract, but it becomes powerful when you apply it to something specific. Let me walk through an example from real client work.
Consider a “Pricing” stage in a B2B sales funnel. In most CRMs, this shows up as a single stage. A deal sits there until it moves forward or stalls. When you look at the average time-in-stage, you might see 16 days. That’s a lot of dead time for what should be a defined process. Most teams look at that and think “we need to speed up pricing.”
But if you crack open that stage and look at what’s actually happening inside it, you find something like five nested funnels:
First, the scoping funnel. The rep needs to take information from the discovery call and translate it into a scoping document. This might involve reviewing notes (if they took any), consulting with a solutions architect, and documenting what the prospect actually needs. That’s a funnel: some deals get scoped quickly and accurately, some get scoped slowly, some never get scoped at all because the discovery was too vague.
Second, the internal pricing funnel. Someone has to take the scope and build the actual pricing. This might require collaboration, approval chains, margin calculations. Another funnel with its own conversion dynamics.
Third, the scheduling funnel. Once the pricing is ready, someone has to get back on a call with the prospect to present it. This is another booked-meeting funnel with all the show-rate dynamics we already talked about.
Fourth, the presentation funnel. The pricing gets presented live (or, in the weaker version, emailed blindly). The prospect reacts, asks questions, pushes back. Another funnel.
Fifth, the decision funnel. After seeing the pricing, the prospect moves toward a decision: yes, no, or “let me think about it” (which is its own funnel of follow-up).
Five funnels inside one pipeline stage. Each with its own width, length, slope, and porosity. Each with its own behavioral and mechanistic levers.
But if you have AI transcription running on your discovery calls and a structured pricing model, you can feed the transcript to the model and have a first-pass scope and price in five minutes. Five days to five minutes. That’s not an incremental gain. That’s a structural compression of one nested funnel that ripples through the other four.
The scheduling funnel has its own leverage. Instead of emailing the prospect afterward (“Hey, I’ll send some time options for a pricing review call”), the rep says on the discovery call itself: “It usually takes us a couple days to put pricing together. Let’s pull up calendars and find a time early next week so I can walk you through it live.” The meeting is booked before the call ends. You’ve just compressed what might have been a 7-day email chase into a 30-second conversation.
And the presentation funnel has enormous behavioral leverage. When pricing gets emailed, the prospect reads it alone, in their worst mental state (no context, no narrator, no one to answer the objection forming in their head). When pricing gets presented live, the rep can read reactions, address concerns, reframe value, and drive the next commitment. Same pricing. Same prospect. Dramatically different close rates.
Five days to five minutes on scoping. Seven days to zero on scheduling. Double the progression rate by presenting live instead of emailing. You’ve taken a 16-day stage and compressed it by 60% or more, and you’ve increased conversion through the whole sequence. All by seeing the funnels inside the stage and working each one.
That’s what higher resolution looks like. The macro number (“16 days in Pricing”) doesn’t tell you where the leverage is. The nested view does.
Five funnels inside one pipeline stage. Each with its own width, length, slope, and porosity. Each with its own behavioral and mechanistic levers.
This is where observability becomes a discipline of belief.
Geometry gives you the vocabulary to describe the state of your sales funnels. But state isn’t static. Different funnels reveal themselves on different timescales, and the metrics that matter most lag behind the changes you make.
This is where most teams lose their nerve.
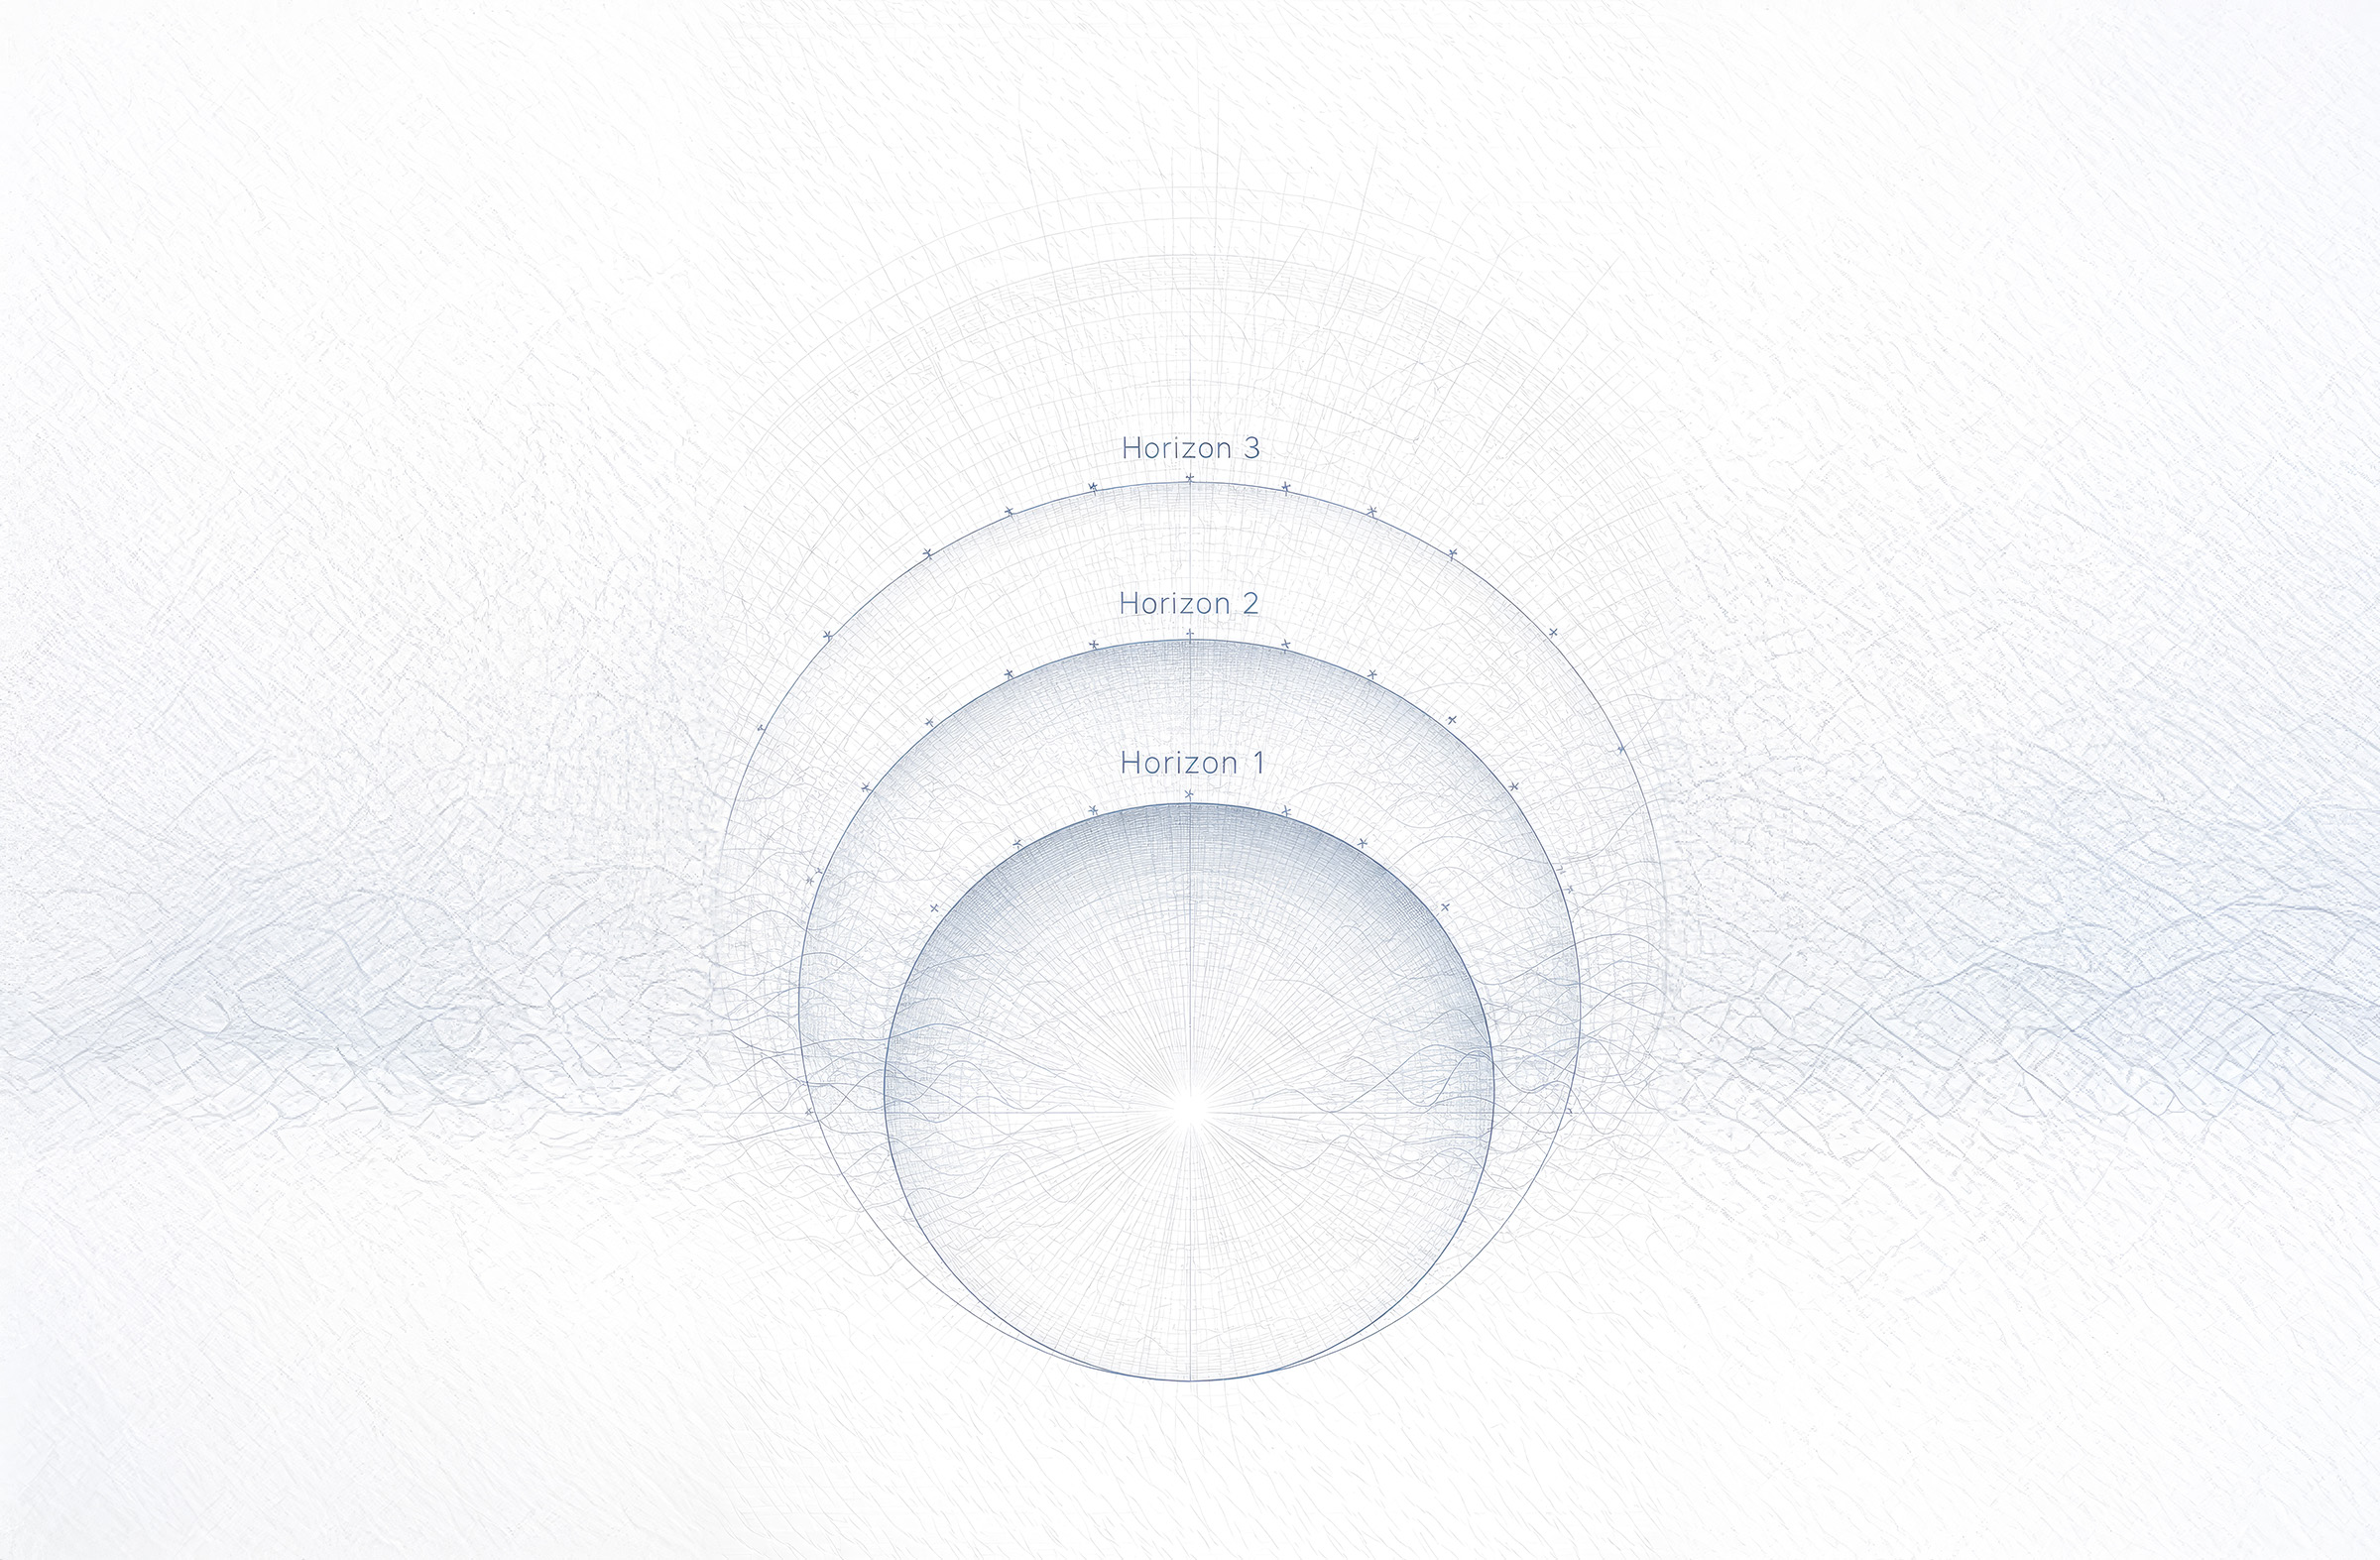
We think about observability on three horizons. Each one answers a different question, and each operates on a fundamentally different cadence.
This is system uptime. Real-time monitoring, daily or less. You’re checking whether the infrastructure you’ve built is functioning as designed. Are the workflows triggering at the right time? Are the emails sending? Are the fields populating correctly after calls? Are the routing rules firing? This is the equivalent of checking whether your servers are up, whether your code deployed correctly, whether the system is in the state you expect it to be in.
It’s not glamorous, but if your H1 is broken, nothing downstream matters. A good Horizon 1 practice: if you’re using AI transcription to extract discovery questions from calls and pipe the answers into your CRM, you should be able to verify daily that the extraction is running, that the data is landing in the right fields, that the state of every post-call record looks the way you designed it to look. If it doesn’t, everything you planned to build on top of it is compromised.
This is directional signal. Days to weeks. You’re looking at leading indicators that suggest your interventions are having an effect. How many discovery calls were held versus booked this week compared to last? What’s the average time-in-stage trending toward? Are reps booking next meetings live or defaulting to email follow-up?
Horizon 2 is where you achieve observability on behavioral patterns. If you build reporting around whether reps are setting next steps on calls, you’ll see within days who’s doing it and who’s not. That’s coachable. That’s fixable. And it’s the kind of thing that compounds quickly when you address it.
This is lagging. Months to years. Conversion rates, revenue, pipeline velocity, customer lifetime value, churn. These are the metrics that leadership and the executive team use to understand how the business is actually trending. They’re the numbers that show up in board decks and quarterly reviews.
Here’s the tension: Horizon 3 metrics are the ones that matter most, but they’re the slowest to move. If you made a significant change to your discovery process today, you might not see the downstream revenue impact for three to six months. The deals that close in the next 60 days were largely shaped by the old process. The new process is feeding deals into the top that won’t reach closed-won for a while. And metrics like lifetime value or customer churn? Those might take a year or more to reflect the changes you’re making now.
This is where observability becomes a discipline of belief.

If you only trust what you can observe in real time, you’ll abandon good process before it has time to prove itself. I’ve watched teams make a smart, well-designed change to their system, then check the macro conversion rate two weeks later, see no movement, and reverse course. Of course there’s no movement. The funnel is long. The signal hasn’t had time to propagate through the system.
You can’t believe in a result. You can only believe in a process. The three horizons are how you maintain that belief. H1 tells you the system is running as intended. H2 tells you the leading indicators are trending in the right direction. H3 will tell you, eventually, whether the bet paid off. But you have to give it time. And you have to have the observability infrastructure in place to know what “enough time” actually looks like for your specific funnel geometry.
Short, steep micro-funnels (like discovery-call-to-next-meeting) give you H3 signal in two weeks, not two months. Long, gradual macro-funnels (like enterprise sales cycles) need quarters. Metrics like LTV might need a year or more before the state of the system tells you something definitive. If you don’t match your observation cadence to the geometry of the funnel, you’ll either be impatient where patience is required or complacent where speed is available.
When you develop the ability to see funnels at high resolution and you start measuring on all three horizons, you’re going to see a lot of drop-off. That’s the nature of the system. Things fall out everywhere.
Behavioral exits are what your team does or doesn’t do. These are the most controllable and often the highest leverage. The rep who finishes a great discovery call and says “I’ll email you some time options” instead of “Let’s look at calendars right now” is creating a behavioral exit. Same lead, same interest level. One path leads to a booked meeting with 90%+ show rate. The other leads to an email chase with rapidly decaying momentum.
Behavioral issues are trainable. They surface fast in Horizon 1 and 2 observability. You can see them, name them, coach them, and measure whether the coaching is working, all within days to weeks.
I can’t tell you how many deals I’ve seen chalked up to “the prospect went cold” when the real story is that the rep didn’t create commitment. Nobody was cold. The team just didn’t hold the momentum.
Mechanistic exits are what your systems do or don’t do. Your automated rebook sequence for no-shows. Your lead scoring that routes prospects appropriately. Your nurture tracks for people who aren’t ready yet. These are buildable. They take a bit longer to diagnose because you need enough volume through the system to see whether the mechanics are working, but they’re squarely within your control.

Economic shifts, budget freezes, internal reorgs at the prospect company or a champion who leaves – competitive dynamics exist outside your control.
Environmental factors are real, and they matter. But they take the longest to distinguish from noise. You need Horizon 3 patience to see them clearly. And here’s the critical thing: if you haven’t built the observability to separate behavioral and mechanistic issues from environmental ones, you’ll misattribute environmental problems to your team or your process, or (more commonly) you’ll blame “the market” for problems that are actually behavioral and totally within your control.
I had a colleague recently share a story that illustrates the extreme version of this. He was digging into lead quality data for a client, and something wasn’t adding up. Even accounting for the normal percentage of garbage in purchased leads, the numbers were off. He brought his findings to the leadership team, and it set off a chain reaction. Someone inside the company was creating fake leads and selling them back through a vendor. It led to lawsuits. Not his problem to fix, but he identified it through the data, through the discipline of observing the actual state of the system versus the expected state.
That’s an extreme case, but the principle is everyday: the first question when you see drop-off isn’t “how do we fix this?” It’s “what’s causing this, and which category does it belong to?” Because the intervention for a behavioral problem (coaching, process change) is completely different from the intervention for a mechanistic problem (automation, system architecture), which is completely different from the response to an environmental problem (acknowledge it, monitor it, adapt your expectations).
Everything I’ve described collapses into a cycle. Four moves, repeated continuously.
Develop the ability to observe funnel geometry at every level. Build the dashboards. Establish the baselines. Train yourself and your RevOps team to look at the nested funnels, not just the macro view.
When you see drop-off, categorize it. Is it behavioral, mechanistic, or environmental? At which horizon does it reveal itself? Are you observing at the right cadence for the geometry of this funnel?
Match your interventions to the geometry. A long, gradual funnel needs patience-based automation, drip nurtures, a cadence that respects the natural timeline. A short, steep funnel needs speed and friction-reduction. A cliff funnel needs focus at the cliff. A porous funnel needs valves. The observability plan is part of the design. If you can’t observe the intervention, you can’t learn from it.
Train behaviors. Construct mechanisms. Monitor environmental factors you can’t control. Deploy the change, put it in the system, and start the observation cycle.
And then the cycle turns. Observation feeds back into seeing. The data you collect at Horizon 1 and 2 sharpens your ability to observe at higher resolution. The Horizon 3 results confirm or challenge your understanding of the geometry. You refine, you redesign, you execute again.
This is the job. Not in the sense of “these are the tasks.” In the sense of “this is the discipline.” RevOps at its best is a practice of continuous observability, continuous diagnosis, continuous design, and continuous execution. It doesn’t end. There’s no steady state where the system is optimized and you can stop looking. The funnels go all the way down. There’s always another level of resolution available, always another nested funnel to discover, always another small gain that compounds through the whole system.
That’s what makes it creative. Not creative in the loose, decorative sense. Creative in the way that architecture is creative, or music production is creative: you’re working with real constraints, real materials, real physics, and you’re trying to make something that works beautifully within those constraints. The constraints are the geometry of your funnels, the behaviors of your team, the mechanics of your systems, and the environment you operate in. The creativity is in how you see them, how you combine interventions, how you design for the actual shape of the thing rather than some generic best practice that was written for someone else’s system.

The funnels go all the way down. That’s not a problem. It’s the nature of the system.
The goal was never to find the bottom. The goal is to see clearly at every level you can reach, and to operate with precision at each one.
What’s happening inside it? What funnels live within it that you’ve never named? What’s the geometry? Where are the exits, and which category are they? What horizon should you be observing on?
You probably already know more than you think you do. The observability is already happening at some level. What changes is the intentionality. The discipline of observing with resolution, measuring with patience, and designing with precision.
The funnels go all the way down. Start seeing them.
— A.H., March 2026
This is a Textbook entry from Levver. More rigorous than a sketch. Built to be used.
The goal is to see clearly at every level you can reach, and to operate with precision at each one.

Conserve energy, magnify force